Type signature: (raw->[raw])
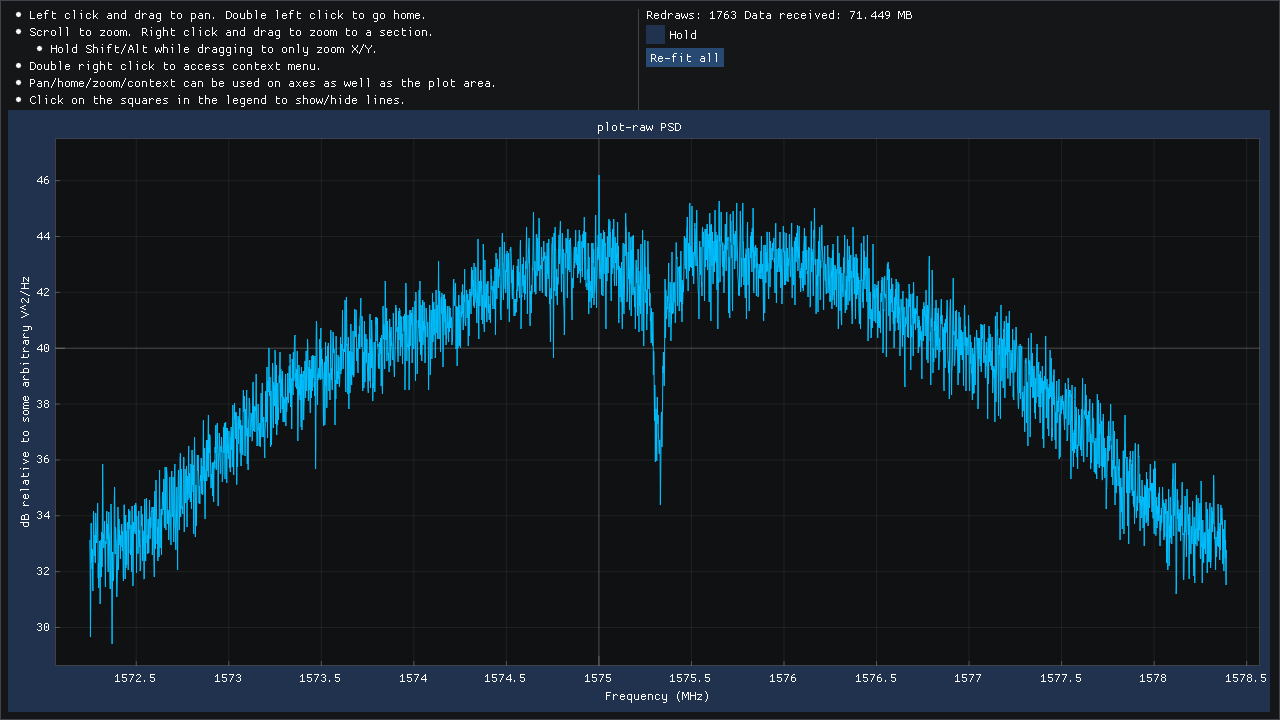 |
Example output of plot-raw node (Infix-2, with antenna plugged in and viewing sky) |
Usage:
plot-raw [OPTION]...
Allowed options:
| Option | Description |
|---|---|
--help | produce help message |
--gnss-stream arg (=0) | GNSS stream to use |
--duration DURATION (=0.01) | length of data to plot (units: seconds) |
--period PERIOD (=0.1) | offset between subsequent plots (units: seconds) |
--offset OFFSET (=0) | offset into each period of data to plot (units: seconds) |
--scale-x SCALE_X (=1) | scale X coordinates by this number (e.g. use 3e8 to make X coordinates meters) |
--wait | wait for each plot to be acknowledged |
--psd | plot power spectral density (default if no other plots are specified) |
--annotate-spurs | measure top 5 spurs and list in PSD plot annotation (enabled by default if no plots are explicitly specified) |
--psd-bins arg (=4096) | number of frequency bins for PSD; automatically clipped to <= DURATION seconds of samples |
--psd-show-dc | show DC bias spike in PSD (default: remove mean from samples before computing periodogram) |
--time | plot time-domain signal |
--time-max-samples arg (=1024) | limit maximum number of samples displayed in time-domain plot |
--histogram | also plot histogram of sample values |
--histogram2 | also plot full histogram of all (I, Q) pairs |
--tone arg | plot the magnitude and phase of a tone that is at this baseband frequency (units: Hertz) |
--statlog-psd-peak FREQUENCY | log power of max PSD point within STATLOG_PSD_RADIUS Hz of FREQUENCY (units: Hertz) |
--statlog-psd-radius STATLOG_PSD_RADIUS (=1e5) | <see --statlog-psd-peak description> (units: Hertz) |
--statlog-total-power | log total power |