The plot-gnss-info node is unlike the other nodes, it does not accept or produce any interface streams and is always the only node in the chain. It's a utility node that plots the power spectral density and autocorrelation of a specific GNSS signal. The other utility nodes are the print-INTERFACE-file-info
The current supported plots are:
Usage:
plot-gnss-info [OPTION]... [GNSS (=GPS_L1)] [SIGNAL]
Allowed options:
| Option | Description |
|---|---|
--help | produce help message |
--gnss GNSS (=GPS_L1) | view plots of GNSS GNSS |
--signal SIGNAL | only plot characteristics of signal SIGNAL |
--bandwidth arg | filter displayed signal by this bandwidth before generating any of the plots except the "infinite bandwidth" one (units: Hertz; two-sided) |
--relative-frequency | make frequency axis relative to GNSS center frequency |
--log-power | use decibels when plotting PSDs |
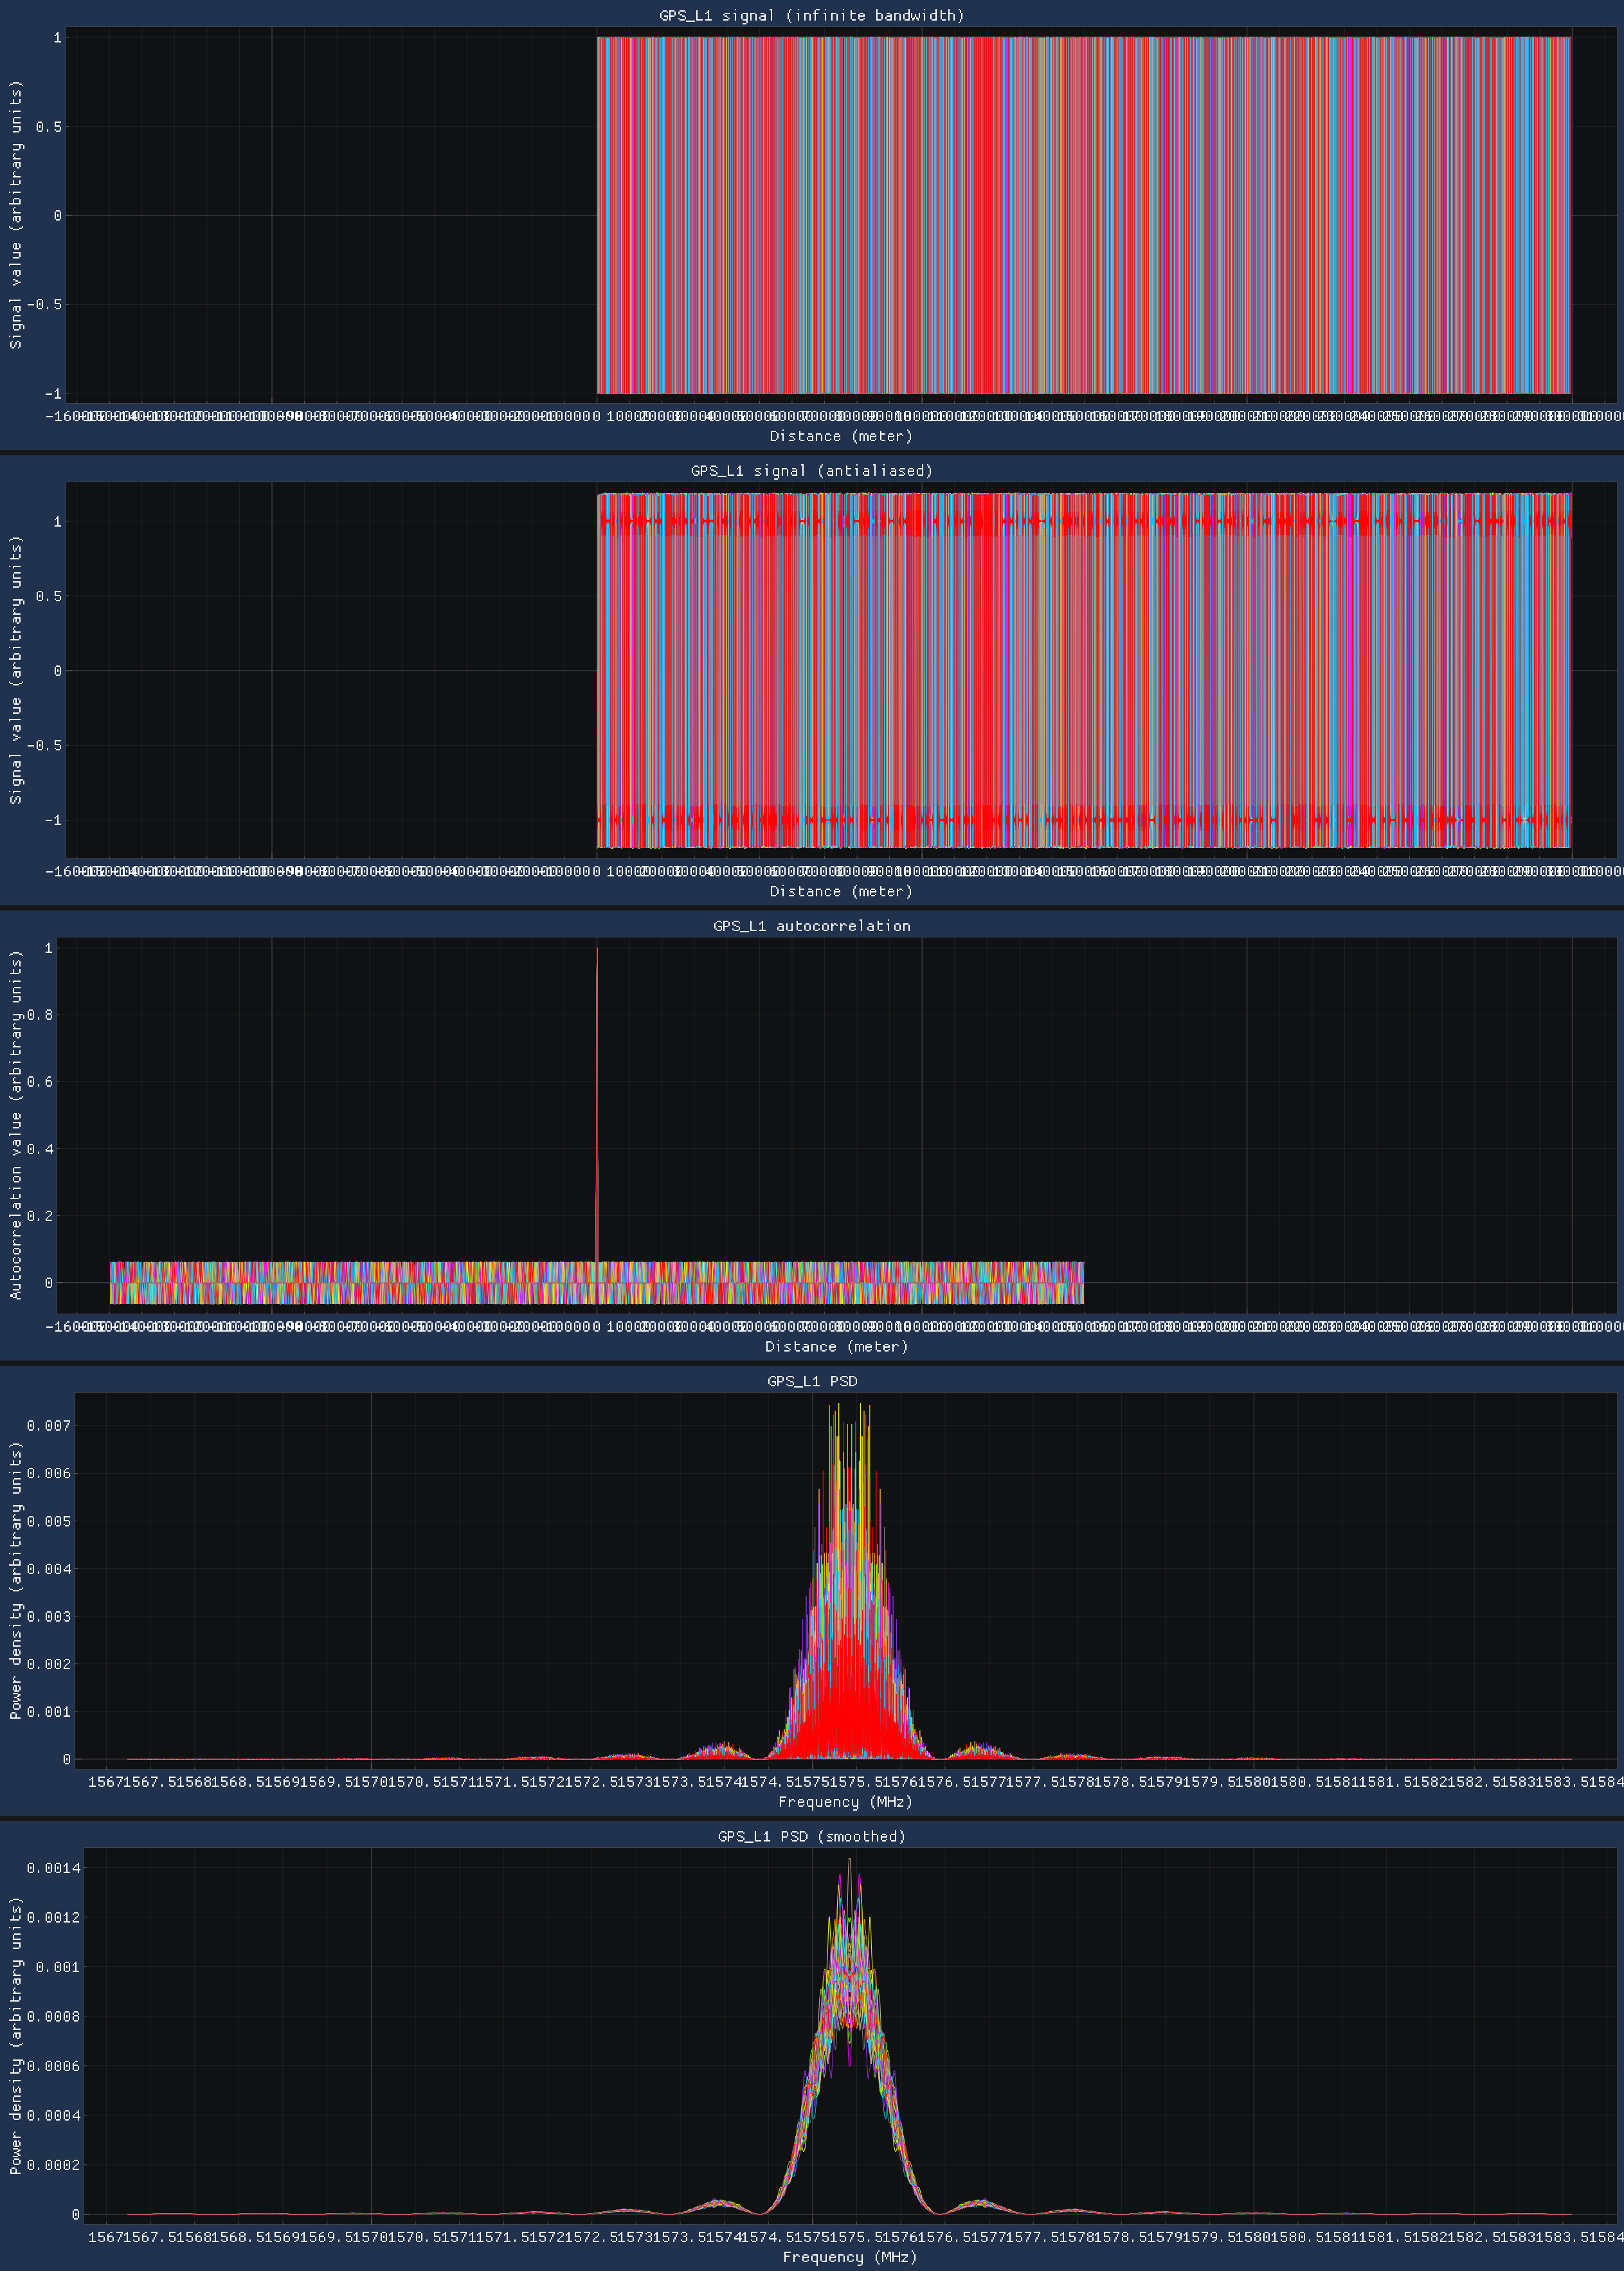
The default output for this node is produced below: